* concepts🤲
⊙ Although EDA and Data Preprocessing are two distinct terms, they involve many overlapping subtasks. At times, they are even used interchangeably ⊙
→ 즉! 모아진 raw data를 data preprocessing 단계를 거치고 난 뒤, preprocessed된 data를 통해 EDA 과정을 거치고 또 data preprocessing하는 과정을 거치는 것처럼 서로 상호작용하며 같이 꼭 행해져야 하는 과정이라 할 수 있다
(EDA 과정 내에 data preprocessing이 들어간다고도 말하기도 함!)
- 하지만 확실한 건 EDA에 들어가는 data insight 얻기, data에 대해 눈대중 결론 내리기, 시각화 과정은 data preprocessing에 포함 X
- data preprocessing을 통해 modeling 또는 quality 좋은 EDA 과정을 거칠 수 있으며, 이것이 본래 목적이다
- interchangeably하게 서로 엮인 관계 -

(EDA posting ↓↓↓↓↓)
https://sh-avid-learner.tistory.com/entry/EDA-Exploratory-Data-Analysis
EDA - Exploratory Data Analysis
1. concepts & goals → 탐색적 데이터 분석 - 수집한 데이터를 본격적으로 분석하기 전에 자료를 직관적으로 바라보는 과정이 필요한데, 이때 EDA를 사용한다 - 데이터 분석의 한 종류로 복잡한 모
sh-avid-learner.tistory.com
- 아무리 좋은 model이다 하더라도 thr레기 data를 넣으면 안좋은 결과가 나올 수 밖에 없음
- 따라서, 목적에 맞게 상황마다 적절히 데이터 전처리를 해주어야 한다
- 또한, missing values, outliers, duplicate 등등 raw data로는 분석이 힘든, 그리고 modeling을 통해 좋은 결과가 나오기가 어려운 경우가 많다. 따라서 우리는 '데이터 전처리' 과정을 꼭 거쳐주어야 함
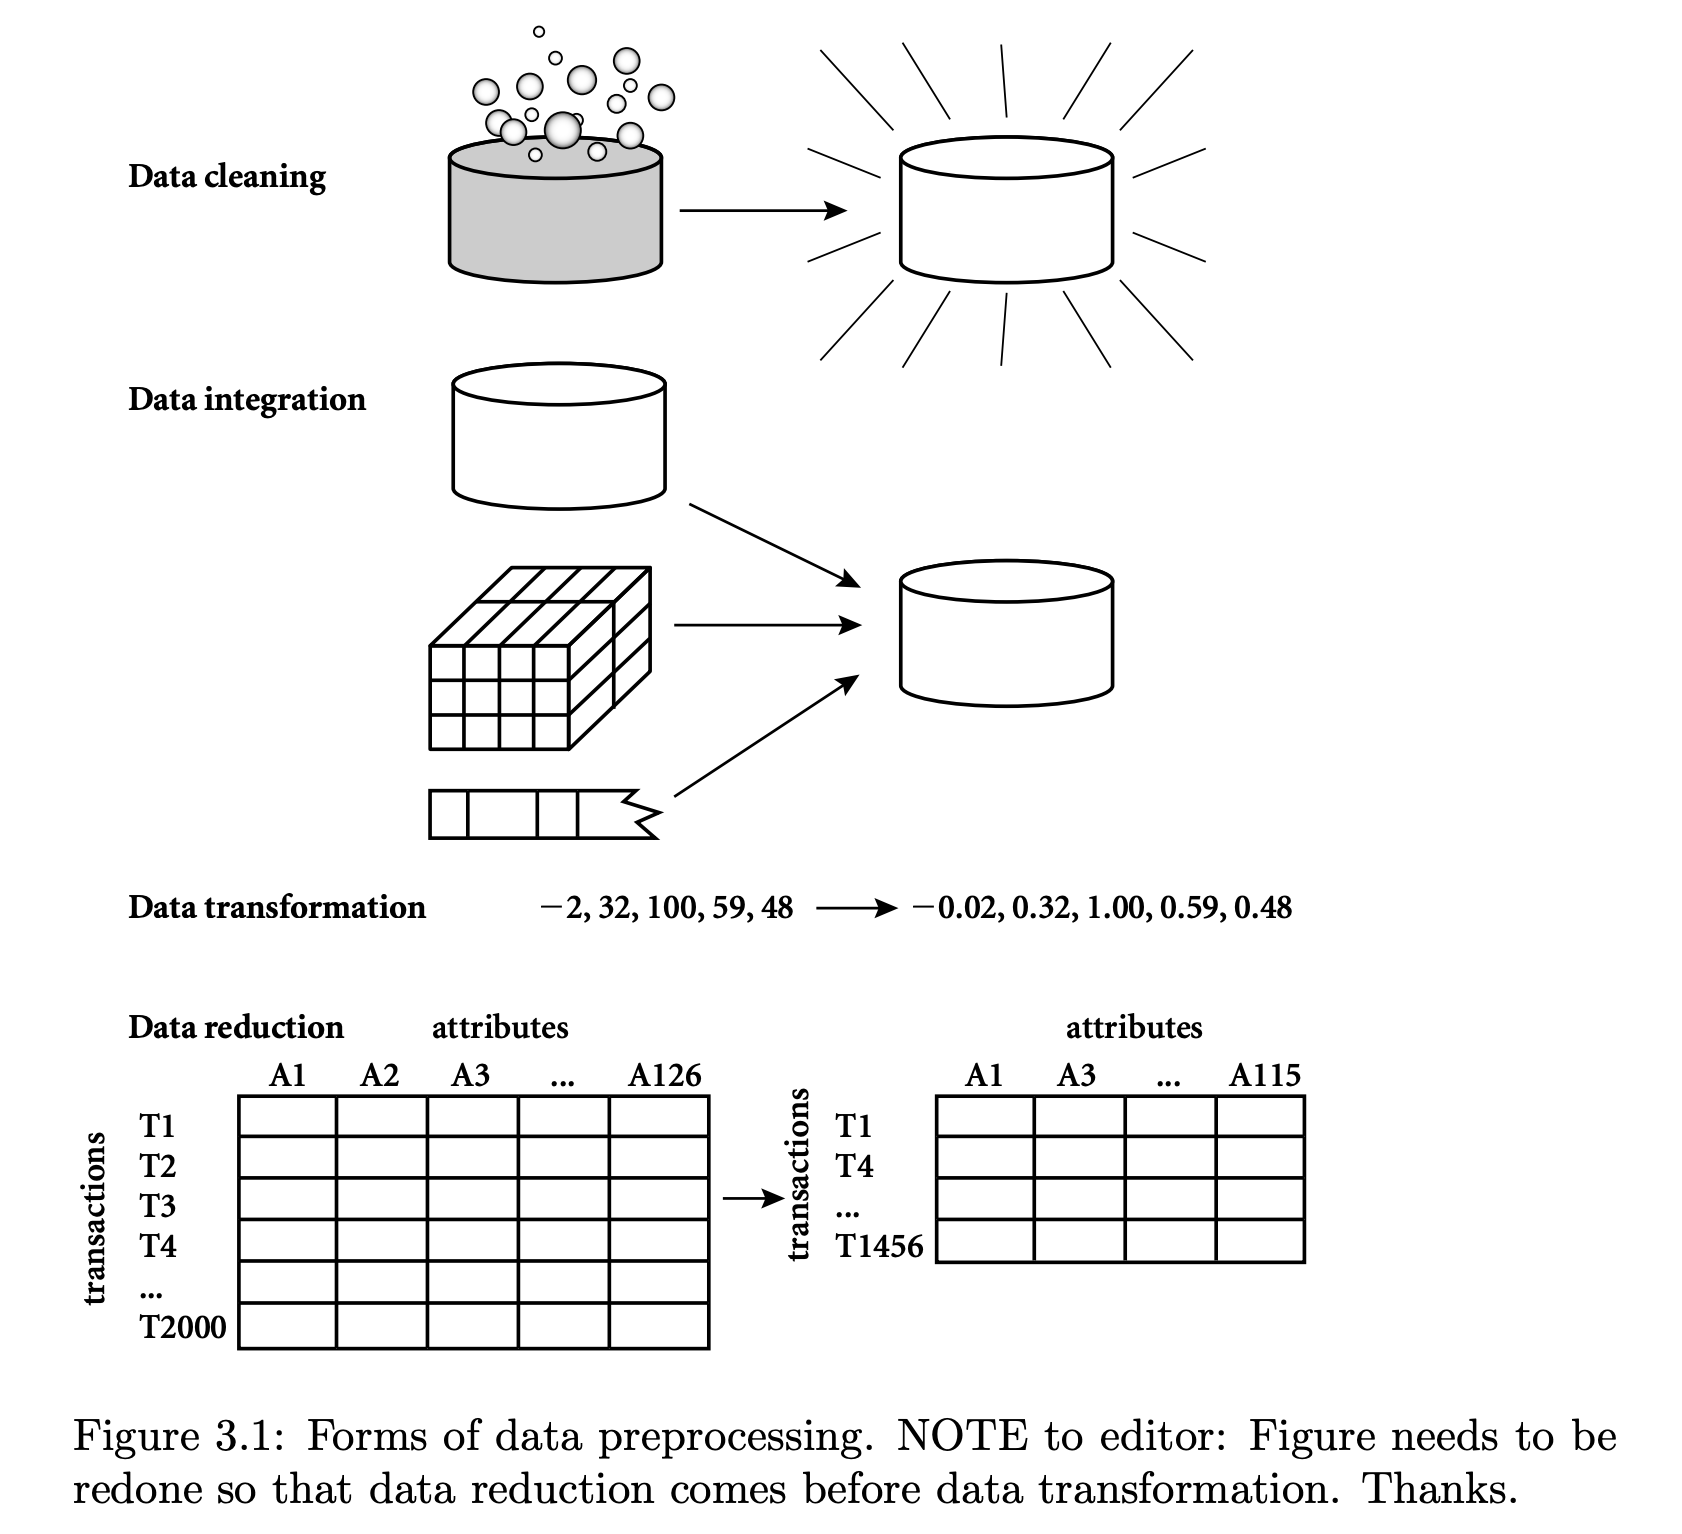
- 크게 cleaning - integration - transformation - reduction으로 나뉨 -
1. Data Cleaning
[1] missing values
→ 해결법으로는 무시하거나(ignore), 삭제하거나, manual fill, 아니면 주위 data 정보를 기반으로 채워넣는(imputation) 방법이 있다
* 기본적으로 isnull.sum() 많이 사용 - 결측치 확인
- 결측치가 존재하면 해당 column에 1이상의 결측치 개수가 뜬다 (결측치 없으면 0)
df.isnull.sum()
(출력 예시 보기)

1> manually fill 방법>
▦ fillna() docu ▦
https://pandas.pydata.org/docs/reference/api/pandas.DataFrame.fillna.html
DataFrame.fillna(value=None, method=None, axis=None, inplace=False, limit=None, downcast=None)
→ method 인자)
- method{‘backfill’, ‘bfill’, ‘pad’, ‘ffill’, None}, default None
- method to use for filling holes in reindexed Series pad / ffill: propagate last valid observation forward to next valid backfill / bfill: use next valid observation to fill gap
(즉, pad와 ffill은 column 기준 앞의 data로 채우고, backfill과 bfill은 뒤의 data로 채움)
Q. 그럼 column 맨 앞과 뒤의 data는?
A. ffill 이후 bfill 이거나 그 순서를 바꿔 설정하면 모두 메꿔짐
df = df.fillna(method='ffill').fillna(method='bfill')
#이 경우는 column 맨 위에 있는 NaN data만 뒤의 data로 채움

df = df.fillna(method='bfill').fillna(method='ffill')
#이 경우는 column 맨 뒤에 있는 NaN data만 앞의 data로 채움
→ 해당 결측치를 manually fill하기 위해 fillna() method를 사용하기도 함
- 인자에 결측치에 넣고 싶은 내용을 넣으면 끝!
df.fillna(0) #0으로 채우고 싶다면
2> 결측치 제거>
→ dropna() method 사용
◈ dropna() docu ◈
https://pandas.pydata.org/docs/reference/api/pandas.DataFrame.dropna.html
DataFrame.dropna(axis=0, how='any', thresh=None, subset=None, inplace=False)
- how = 'any' (default): listwise 방식으로 null 값 제거하는 방식 (결측치가 한 개라도 존재하면 해당 row 제거)
- how = 'all' (결측치가 한 row에 모두 존재해야 해당 row 제거)
[2] noisy data
"involves removing a random error or variance in a measured variable. It can be done with the help of the following techniques"
** 탐지는 EDA의 visualization, descriptive statistics 방법들을 통해 가능!
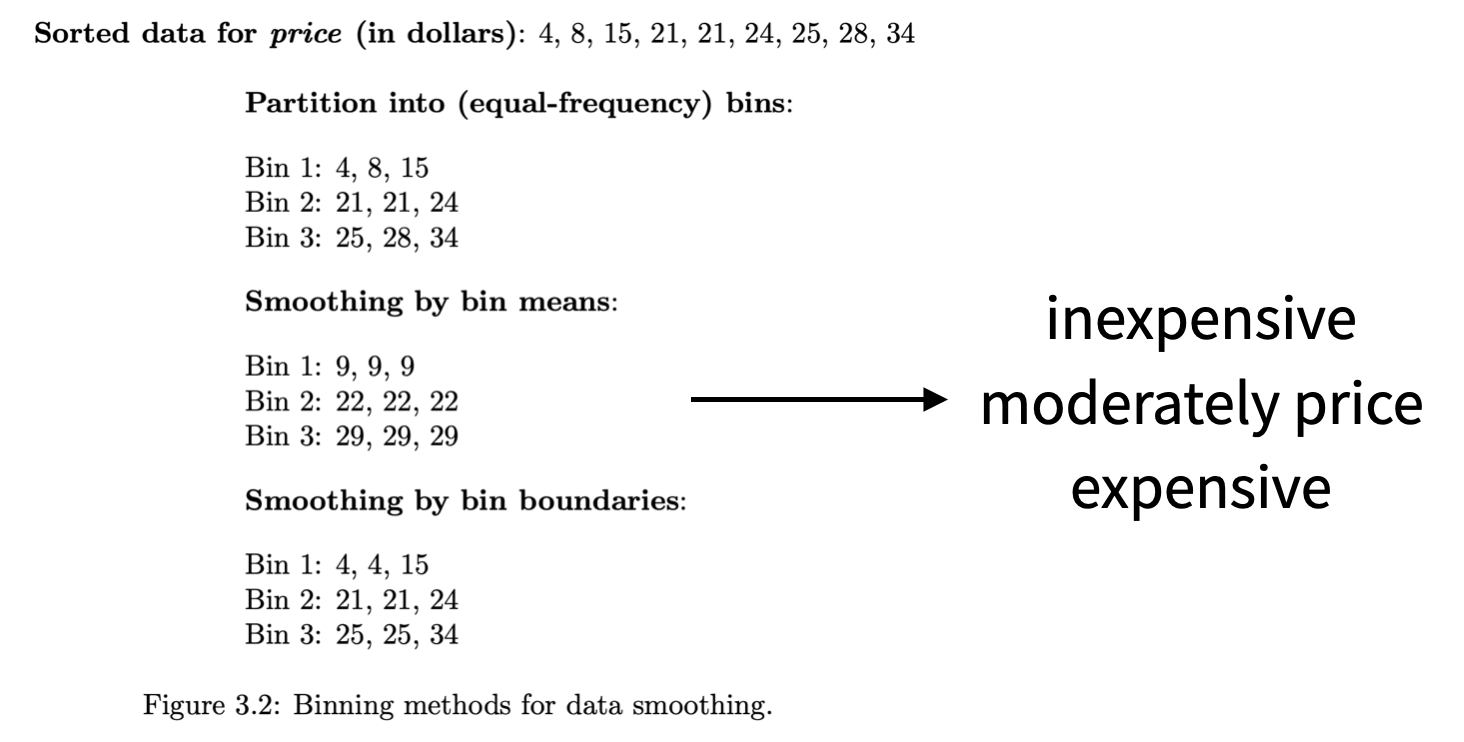
→ binning) It is the technique that works on sorted data values to smoothen any noise present in it. The data is divided into equal-sized bins, and each bin/bucket is dealt with independently. All data in a segment can be replaced by its mean, median or boundary values. (즉, 여러 구간으로 나누어 특정 구간에 noisy data가 존재한다면 주변 data를 참고하여 smoothen하는 방식!)
(binning 예시)
→ regression) This data mining technique is generally used for prediction. It helps to smoothen noise by fitting all the data points in a regression function. The linear regression equation is used if there is only one independent attribute; else Polynomial equations are used (regression은 회귀 function을 만들고 noisy data에 회귀 function 값을 넣음)
→ clustering) Creation of groups/clusters from data having similar values. The values that don't lie in the cluster can be treated as noisy data and can be removed (비슷한 data끼리 그룹짓고 아닌 noisy data는 삭제)
[3] removing outliers
→ clustering의 결과 or box plot/violin plot의 감지를 통해 (EDA 과정 중 발견) 알아내고 제거! (이후 과정에서 결론 도출에 영향을 준다면)
* boxplot
https://sh-avid-learner.tistory.com/entry/box-plot-seaborn
box plot (+seaborn)
* 저번 EDA 개념 포스팅에서 EDA가 무엇인지 알아보았고, data 종류별 & 상황별 적절한 시각화 예에 대해서 공부했다. https://sh-avid-learner.tistory.com/entry/EDA-Exploratory-Data-Analysis EDA - Explorat..
sh-avid-learner.tistory.com
* violin plot
[4] removing duplicated rows
🤹♀️ 혹시나 만약 중복이 있는 지 확인하기 위해 전처리 과정에서 꼭 확인해야 하는 '중복 행 여부 확인'!
> duplicated() method를 사용하면 중복된 행들이 쭉 출력된다!
df[df.duplicated() == True]
> drop_duplicates()를 활용해 중복된 행들을 없애기! (inplace=True 설정해서 그 자리에서 없애야 한다)
df.drop_duplicates(inplace=True)
2. Data Integration
→ 여러 개로 나뉘어져 있는 data를 분석하기 편하게 하나로 합치는 과정
- 추후 merge, concat, append, join 함수 포스팅 예정
(추후 포스팅 완료 시 아래 첨부 ↓↓↓↓)
3. Data Transformation
→ 데이터의 형태를 변환하는 작업 (scaling이라 부르기도 함)
[1] normalization
"It is the most important Data Transformation technique widely used. The numerical attributes are scaled up or down to fit within a specified range. In this approach, we are constraining our data attribute to a particular container to develop a correlation among different data points(이게 목적. 정규화함으로써 타 data와 연관성 있는 분석을 하기 위해!). Normalization can be done in multiple ways" → min-max, Z-score, Decimal scaling 등등 (역시 추후 포스팅 예정)
[2] generalization
* 주어진 data를 일반화해서 표현 (맨 하단 출처 들어가면 바로 이해 가능!)
"The low-level or granular data that we have converted to high-level information by using concept hierarchies. We can transform the primitive data in the address like the city to higher-level information like the country."
(+) "the process of creating a more broad categorization of data in a database, essentially ‘zooming out’ from the data to create a more general picture of trends or insights it provides."
(data generalization 예시)

[3] aggregation
* 일종의 data를 요약한 형태로 보여줌
"It is a method of storing and presenting data in a summary format. For example sales, data can be aggregated and transformed to show as per month and year format."
[4] attribute selection
* 기존 feature를 기반으로 새로운 feature를 만드는 FE!
"New properties of data are created from existing attributes to help in the data mining process. For example, date of birth, data attribute can be transformed to another property like is_senior_citizen for each tuple, which will directly influence predicting diseases or chances of survival, etc."
(하단 FE 포스팅 참조 ↓↓↓↓)
https://sh-avid-learner.tistory.com/entry/FE-Feature-Engineering
FE - Feature Engineering
1. Concepts * In real world, data is really messy - we need to clean the data * FE = a process of extracting useful features from raw data using math, statistics and domain knowledge - 즉, 도메..
sh-avid-learner.tistory.com
4. Data Reduction
"The size of the dataset in a data warehouse can be too large to be handled by data analysis and data mining algorithms. One possible solution is to obtain a reduced representation of the dataset that is much smaller in volume but produces the same quality of analytical results"
→ data cube aggregation(expressed in a summary form)
→ dimensonality reduction(feature extraction; PCA)
→ data compression(using encoding technology - can be loss or lossless)
→ discretization(divide into some intervals)
→ numerosity reduction(data as a model like a regression model)
→ attribute subset selection(Only attributes that add more value towards model training should be considered, and the rest all can be discarded.)
** 출처) https://en.wikipedia.org/wiki/File:Data_visualization_process_v1.png
** 출처2) https://www.v7labs.com/blog/data-preprocessing-guide#what-is-data-preprocessing
** 출처3 - data generalization) https://www.immuta.com/articles/what-is-data-generalization/
'Computer Science > Concepts' 카테고리의 다른 글
| Tidy Data (0) | 2022.04.13 |
|---|---|
| REST API example - Coingecko API (0) | 2022.03.30 |
| Tabular Data 🗄️ (0) | 2022.03.26 |
| FE - Feature Engineering (0) | 2022.03.22 |
| EDA - Exploratory Data Analysis (0) | 2022.03.22 |

댓글