1. Data Scientist's Toolkit
[1] Languages of Data Science
# Python
→ by far the most popular programming language for data science
→ it uses clear, readable syntax. You can do many of the things you are used to doing in other programming languages but with Python you can do it with less code.
→ a high-level general-purpose programming language that can be applied to many different
classes of problems.
→ It has a large, standard library that provides tools suited to many different tasks
→ can use Python's scientific computing libraries such as Pandas, NumPy, SciPy, and Matplotlib
→ For artificial intelligence, it has TensorFlow, PyTorch, Keras, and Scikit-learn
→ Python can also be used for Natural Language Processing (NLP) using the Natural Language Toolkit (NLTK)
→ the Python community, which has a well documented history of paving the way for diversity and inclusion efforts in the tech industry as a whole
# R
→ Like Python, R is free to use, but it's a GNU project -- instead of being open source, it's actually free software
→ Because this is a free software project, you can use the language in the same way that you contribute to open source, and it allows for public collaboration and private and commercial use. Plus, R is another language supported by a wide global community of people passionate about making it possible to use the language to solve big problems.
→ most often used by statisticians, mathematicians, and data miners for developing statistical
software, graphing, and data analysis.
→ The language’s array-oriented syntax makes it easier to translate from math to code
→ R has become the world’s largest repository of statistical knowledge. As of 2018, R has more than 15,000 publicly released packages, making it possible to conduct complex exploratory data analysis.
→ R integrates well with other computer languages, such as C++, Java, C, .Net, and Python.
→ Common mathematical operations such as matrix multiplication work straight out of the box.
→ R has stronger object-oriented programming facilities than most statistical computing languages.
# SQL
→ many people do not consider SQL to be like other software development languages because it's a non-procedural language and its scope is limited to querying and managing data.
→ This language is useful in handling structured data; that is, the data incorporating relations among entities and variables.
→ SQL was designed for managing data in relational databases
→ The SQL language is subdivided into several language elements, including clauses, expressions, predicates, queries, and statements.

* a MUST in data engineering
→ the interpreter between you and the database
# Java
→ a tried-and-true general-purpose object oriented programming language.
→ It's been widely adopted in the enterprise space and is designed to be fast and scalable
→ Java applications are compiled to bytecode and run on the Java Virtual Machine, or "JVM."
# Scala
→ a general-purpose programming language that provides support for functional programming and a strong static type system
→ Many of the design decisions in the construction of the Scala language were made to address criticisms of Java.
→ Scala is also interoperable with Java, as it runs on the JVM
→ The name "Scala" is a combination of "scalable" and "language"
→ Apache Spark
# C++
- a general-purpose programming language.
- It is an extension of the C programming language, or "C with Classes.”
- C++ improves processing speed, enables system programming, and provides broader control over the software application.
- For data science, a popular deep learning library for dataflow called TensorFlow was built with C++. But while C++ is the foundation of TensorFlow, it runs on a Python interface, so you don’t need to know C++ to use it.
# JavaScript
- a general-purpose language that extended beyond the browser with the creation of Node.js and other server-side approaches.
- NOT related to the Java language.
# Julia
- It was designed at MIT for high-performance numerical analysis and computational science.
- It provides speedy development like Python or R, while producing programs that run as fast as C or Fortran programs.
- It is compiled, which means that the code is executed directly on the processor as executable code
[2] Data Science Tools
→ Data Management) the process of persisting and retrieving data
→ Data Integration and Transformation) often referred to as Extract, Transform, and Load, or “ETL,” is the process of retrieving data from remote data management systems. Transforming data and loading it into a local data management system is also a part of Data Integration and Transformation
→ Data Visualization) part of an initial data exploration process, as well as being part of a final deliverable
→ Model Building) the process of creating a machine learning or deep learning model using an appropriate algorithm with a lot of data.
→ Model deployment) makes such a machine learning or deep learning model available to third-party
applications
→ Model monitoring and assessment) ensures continuous performance quality checks on the deployed
models. These checks are for accuracy, fairness, and adversarial robustness
→ Code asset management) uses versioning and other collaborative features to facilitate teamwork.
→ Data asset management) brings the same versioning and collaborative components to data. Also supports replication, backup, and access right management
→ Development environments) commonly known as Integrated Development Environments, or “IDEs”,
are tools that help the data scientist to implement, execute, test, and deploy their work
→ Execution environments) tools where data preprocessing, model training, and deployment take place
→ Fully integrated, visual tooling) covers all the previous tooling components, either partially or completely

-- with some cases --
→ Data Management) relational databases such as MySQL and PostgreSQL; NoSQL databases such as MongoDB, Apache CouchDB, and Apache Cassandra; and file-based tools such as the Hadoop File System or Cloud File systems like Ceph. Elasticsearch is mainly used for storing text data and creating a search index for fast document retrieval.
→ Data Integration and Transformation) ETL(These days, data scientists often propose the term “ELT” – Extract, Load, Transform“ELT”, stressing the fact that data is dumped somewhere and the data engineer or data scientist themself is responsible for data.) or "Data Refinery and cleansing" - Apache AirFlow, originally created by AirBNB; KubeFlow, which enables you to execute data science pipelines on top of Kubernetes; Apache Kafka, which originated from LinkedIn; Apache Nifi, which delivers a very nice visual editor; Apache SparkSQL (which enables you to use ANSI SQL and scales up to compute clusters of 1000s of nodes), and NodeRED, which also provides a visual editor.
→ Data Visualization) A similar approach uses Hue, which can create visualizations from SQL queries. Kibana, a data exploration and visualization web application, is limited to Elasticsearch (the data provider). Apache Superset is a data exploration and visualization web application.
→ Model deployment) "Extremely Important" you should make that model consumable by other developers and turn it into an API - Apache PredictionIO, Seldon, MLeap, Tensorflow
→ Model monitoring and assessment) Another crucial step - ModelDB, Prometheus, IBM Adversarial Robustness 360
→ Code asset management) Git(GitHub - provides hosting for software development version management), GitHab, BitBucket
→ Data asset management (data governance or data lineage)) crucial - Apache Atlas, ODPi Egeria, Kylo
→ Development environments) "Jupyter" - A key property of Jupyter Notebooks is the ability to unify documentation, code, output from the code, shell commands, and visualizations into a single document.
"Jupyter Lab" - the main difference introduced by JupyterLab is the ability to open different types of files.
"R studio" - exclusively runs R and all associated R libraries. RStudio unifies programming, execution, debugging, remote data access, data exploration, and visualization into a single tool
→ Execution environments) Sometimes your data doesn’t fit into a single computer’s storage or main memory capacity. "Apache Spark"(usually be choice) - Linear Scalability. After Apache Spark began to gain market share, Apache Flink was created. The key difference between Apache Spark and Apache Flink is that Apache Spark is a batch data processing image, capable of processing huge amounts of data file by file. Apache Flink, on the other hand, is a stream processing image, with its main focus on processing real-time data streams.
→ Fully integrated, visual tooling) KNIME, Orange
[3] Libraries for DS
** <Libraries> = a collection of functions and methods that enable you to perform a wide variety of actions without writing the code yourself **
# Python Libraries
1) Scientific Computing Libraries in Python
→ Pandas) offers data structures and tools for effective data cleaning, manipulation, and analysis. It provides tools to work with different types of data. The primary instrument of Pandas is a two-dimensional table consisting of columns and rows. This table is called a “DataFrame” and is designed to provide easy indexing so you can work with your data.
→ Numpy) is based on arrays, enabling you to apply mathematical functions to these arrays.
2) Visualization Libraries in Python
→ Matplotlib) excellent for making graphs and plots. The graphs are also highly customizable
→ Seaborn) makes it easy to generate plots like heat maps, time series, and violin plots.
** difference btw Matplotlib vs. Seaborn? **
Seaborn vs Matplotlib
👏 정리 너무 잘해놓은 GeeksforGeeks 포스팅 글 그대로 발췌 👏 👐 Data Visualization is the graphic representation of data. It converts a huge dataset into small graphs, thus aiding in data analysi..
sh-avid-learner.tistory.com
3) High-Level ML & Deep Learning Libraries
(High-Level: don't have to worry about details tho this makes it difficult to study or improve)
→ Scikit-learn) contains tools for statistical modeling, including regression, classification, clustering and others. It is built on NumPy, SciPy, and matplotlib, and it’s relatively simple to get started. For this high-level approach, you define the model and specify the parameter types you would like to use.
- Keras) enables to build the standard deep learning model.
- Tensorflow) a low-level framework used in large scale production of deep learning models. It’s designed for production but can be unwieldy for experimentation.
- Pytorch) is used for experimentation, making it simple for researchers to test their ideas
# R Libraries
→ ggplot2) a popular library for data visualization
[4] API
# API?
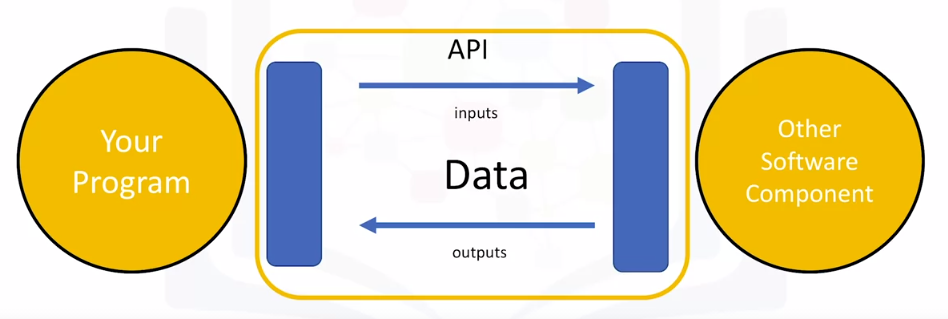
→ use the API to communicate with the other software components
→ the API only refers to the interface, or the part of the library that you see. The “library” refers to the whole thing
→ (ex. pandas) We use the pandas API to process the data by communicating with the other software components
# REST APIs (REpresentational State Transfer APIs)
- The API communicates with a web service that you call through the internet. A set of rules governs Communication, Input or Request, and Output or Response.

→ You or your code can be thought of as a client. The web service is referred to as a resource. The client finds the service through an endpoint. The client sends the request to the resource and the response to the client.
→ HTTP methods are a way of transmitting data over the internet
→ We tell the REST APIs what to do by sending a request. The request is usually communicated through an HTTP message.
→ The HTTP message usually contains a JSON file, which contains instructions for the operation that we would like the service to perform. This operation is transmitted to the web service over the internet. The service performs the operation
→ Similarly, the web service returns a response through an HTTP message, where the information is usually returned using a JSON file. This information is transmitted back to the client
[5] Data Sets
"a structured collection of data"
# Data Structures
→ Tabular data) comprises a collection of rows, which in turn comprise columns that store the information
(CSV - a delimited text file where each line represents a row and data values are separated by a comma)
Tabular Data 🗄️
Tabular Data is... 1. Data organized into a table 2. Table is a grid of data 3. Column must be same type (homogenous data) 4. (but) Row can contain many types (heterogenous data) (ofc each eleme..
sh-avid-learner.tistory.com
→ Hierarchical or network data structures) typically used to represent relationships between data.
(Hierarchical data is organized in a tree-like structure, whereas network data might be stored
as a graph)
→ Raw files) image & audio, MNIST dataset
#CDLA - Community Data License Agreement
→ CDLA-Sharing) grants you permission to use and modify the data. The license stipulates that if you publish your modified version of the data you must do so under the same license terms as the original data.
→ CDLA-Permissive) also grants you permission to use and modify the data. However, you are not required to share changes to the data.
+ DAX(Data Asset eXchange) - provides a trusted source for finding open data sets that are ready for to use in
enterprise applications
[6] ML/DL Models
🧤 Machine learning uses algorithms – also known as ”models” - to identify patterns in the data. The process by which the model learns these patterns from data is called “model training." Once a model is trained, it can then be used to make predictions. When the model is presented with new data, it tries to make predictions or decisions based on the patterns it has learned from past data.
# 3 ML Models
→ Supervised Learning) a human provides input data and the correct outputs. The model tries to identify relationships and dependencies between the input data and the correct output. (regression & classification problems)
→ Unsupervised Learning) the data is not labelled by a human. The models must analyze the data and try to identify patterns and structure within the data based only on the characteristics of the data itself. (clustering & anomaly detection)
(e.g providing purchase recommendations for an e-commerce store based on past shopping behavior and the content of a shopping basket. Anomaly detection identifies outliers in a data set, such as fraudulent credit card transactions or suspicious online log-in attempts)
→ Reinforcement Learning) learns the best set of actions to take, given its current environment, in order to get the most reward over time.
# Deep Learning (a speicalized set of machine learning): a general set of models and techniques that tries to loosely emulate the way the human brain solves a wide range of problems
→ typically requires very large data sets of labeled data to train a model
→ implemented using popular frameworks such as TensorFlow, PyTorch, and Keras

2. Open Source Tools
[1] Jupyter Notebook & JupyterLab
# Jupyter Notebook) allows a Data Scientist to record their data experiments, their results, and allows for the same experiment to be used and repeated by anyone & allows Data Scientists to combine descriptive text, code blocks, and code output in a single file.
→ When you run the code, it generates the outputs, including plots and tables, within the notebook file. And you can then export the notebook to a PDF or HTML file that can be then be shared with anyone.
→ Nowadays, the notebook supports many other languages as well. It can be used with a cloud-based service like IBM and Google Collab.
→ kernel) a computational engine that executes the code contained in a Notebook file. When you open a Notebook document, the associated kernel is automatically launched. When the notebook is executed, the kernel performs the computation and produces the results (part of the operating system the Jupyter server runs on (x))
→ advanced markdown styling)
adam-p/markdown-here
Google Chrome, Firefox, and Thunderbird extension that lets you write email in Markdown and render it before sending. - adam-p/markdown-here
github.com
# JupyterLab) a browser-based application that allows you to access multiple Jupyter Notebook files as well as other code and data files.
→ extends the functionalities of Jupyter notebooks by enabling you to work with multiple notebooks, text editors, terminals, and custom components in a flexible, integrated, and extensible manner.
→ allows for: Interactive control of the notebook cells and output, real time editing markdowns, CSV etc.
→ It is compatible with several file formats like CSV, JSON, PDF, Vega and more
→ open source
[2] R & R Studio
# R) a statistical programming language.
- a powerful tool for data processing and manipulation, statistical inference, data analysis, and ML algorithms & a preferred language for some Data Scientists because it is easy to use the functions within R
- It is also known for producing great visualizations and readily available packages to handle data analysis without the need to install any libraries
# R Studio) One of the most popular environments for developing and running R language source code and programs

# Popular R libraries for DS
→ dplyr (manipulating data), stringr (manipulating strings), caret (ML)
# data visualization
→ ggplot) for data visualizations such as histograms, bar charts, scatterplots etc. it allows adding layers and components on a single visualization
→ plotly) an R package can be used to create web-based data visualizations that can be displayed or saved as individual HTML files
→ lattice) a data visualization tool that is used to implement complex, multi-variable data sets
→ leaflet) popular for creating interactive plots
[3] Git & GitHub
# A Version Control System) allows you to keep track of changes to your documents
→ This makes it easy for you to recover older versions of your document if you make a mistake, and it makes collaboration with others much easier
# Git) free and open source software distributed under the GNU General Public License
→ a distributed version control system, which means that users anywhere in the world can have a copy of your project on their own computer; when they’ve made changes, they can sync their version to a remote server to share it with you
# GitHub) one of the most popular web-hosted services for Git repositories
→ SSH protocol) a method for secure remote login from one computer to another
→ repository) contains your project folders that are set up for version control
→ fork) a copy of a repository
→ pull request) the way you request that someone reviews and approves your changes before they become final
→ working directory) contains the files and subdirectories on your computer that are associated with a Git repository
# commands)
- When starting out with a new repository, you only need create it once: either locally, and then push to GitHub, or by cloning an existing repository by using the command git init
→ git add moves changes from the working directory to the staging area
→ git status allows you to see the state of your working directory and the staged snapshot of your changes
→ git commit takes your staged snapshot of changes and commits them to the project (-m "message")
→ git push takes your local change(local repos) to the remote repository
→ git pull pulls the file that is added in remote repository to local repository
→ git reset undoes changes that you’ve made to the files in your working directory.
→ git log enables you to browse previous changes to a project
→ git branch lets you create an isolated environment within your repository to make changes.
→ git checkout lets you see and change existing branches
→ git merge lets you put everything back together again
# Working with Branches
→ branch = a snapshot of your repository to which you can make changes
→ the main branch(Master) = the one with deployable code and the official working version of your project. It is meant to be stable and it is always advisable never to push any code that is not tested to master.
→ Child Branch = create a copy of the workflow to the child branch in the child branch, changes and experiments are done
→ We will build and make edits, test the changes and when we are satisfied with the changes, we will merge it back to the master branch where we prepare the model for deployment.
(We can see that all of this is done outside of the main branch and until we merge, changes will not be made to the workflow before we branched)
→ To ensure that changes done by one member, does not impede or affect the flow of work of other members, multiple branches can be created and merged appropriately to master after the workflow is properly tested and approved.


→ pull request) a way to notify other team members of your changes and edits and ask them for review so they can be pulled or merged into the master branch
* 출처) <Tools for Data Science> (by Coursera)
'Computer Science > Basics' 카테고리의 다른 글
| in where? 🦸♀️ - AI examples (0) | 2022.04.17 |
|---|---|
| What is Data Science? (from Coursera) (0) | 2022.04.13 |
| (basic) CLI & 간단 명령어 (linux) & python 가상환경 (0) | 2022.03.31 |
| Data Science Methodology (from Coursera) (0) | 2022.03.27 |
| data 분석 개요 & (1) 문제 정의, (2) 수집 (0) | 2022.03.23 |

댓글