* 확률분포 여태까지 총 3개에 대해서 배웠다 (z-분포 포함)
🎄 student's t-distribution
distribution≫ Student's t-distribution (in-depth)
✋ 통계에 있어서 빼먹지 않아야 할, 무조건 숙지해야 할 '통계분포' 개념 오늘은 가장 많이 사용하고 꼭 알아야 할 t-분포에 대해서 알아보려 한다 사실 저번 두 포스팅에서 t-분포에의 검정통계
sh-avid-learner.tistory.com
🎄 𝜒2 distribution
𝜒2 distribution + One-Sample 𝜒2 test
😽 저번 시간에 parametric vs. non-parametric 차이에 대해서 배웠다. 😽 이번 포스팅에는 non-parametric test를 처음으로 배워보려 함! 카이제곱 검정 첫번째 test - 적합도 검정에 대해서 알아보ZA! 🤩 (독
sh-avid-learner.tistory.com
🎄 f distribution
f distribution
🤠 저번 시간에 총 두 개의 분포 student's t-distribution & 𝜒2 distribution에 대해서 배웠다 (z-distribution과 더불어!) 🧚🏾♂️ student's t-distribution distribution≫ Student's t-distribution (in-..
sh-avid-learner.tistory.com
🎄 이젠 binomial distribution에 대해서 배워보자
concepts>
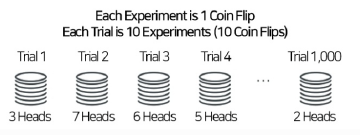
👨🍳 원리! = 성공 or 실패 두 가지로만 결과가 나오는 Bernoulli Trial (성공 확률 p)을독립적으로 n번 반복
👨🍳 ex) 동전을 10번 던짐 (각 던진 event는 앞면 또는 뒷면의 두 가지로만 결과가 나오는 Bernoulli Trial) - 그 중 몇 개가 앞면인지를 하나의 사건으로 확률변수를 정함
- 아래의 경우 동전던지는 Bernoulli Trial을 10번 반복 → 확률변수가 3, 7, 6, 5 ~ 2로 나옴 -
👨🍳 이항분포 - 확률변수 X는 n번 시행 중 '성공의 횟수'
→ 즉 확률변수는 이산형 (X는 0이상의 정수)
→ 확률질량함수 $$f(x) = P(X=x) = \binom{n}{x}p^x*(1-p)^{n-x}$$
→ X~Bin[n,p]
👨🍳 즉 시행횟수 n과 한 번 시행 시 성공확률 p를 알면 (두 개의 모수 n과 p) 이항분포 Binomial 분포를 알게된다
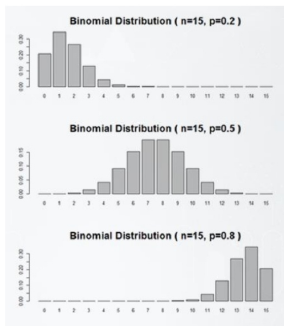
👨🍳 개형> (아래 시각화 code로 증명해보자)
→ p가 0에 가까울 때 오른꼬리가 긴 경향을 보임
→ p가 0.5에 가까우면 1/2 근처에서 높은 형태의 그래프
→ p가 1에 가까우면 왼쪽꼬리가 긴 경향 (n번 반복 시 대체로 성공확률을 보임)
※ 확률변수는 '성공횟수'이므로 성공확률에 따라 성공횟수에 차이가 생겨 X가 자유자재로 바뀌므로 분포가 자유롭게 바뀐다
👨🍳 특성치>
→ E[X] = np, V[X] = np(1-p)
ex) 1명 환자 치료 시 치료 성공 확률이 0.7이며 치료 성공/실패 여부는 베르누이 시행을 따른다고 가정한다. 그러면 4명 환자 치료시 기댓값은 2.8, 즉 평균적으로 2.8명의 환자가 치료 시 성공 가능하다고 결론을 내릴 수 있음
w/code
(아래 binomial 함수는 정확히 말하면 이항분포를 만들고 해당 분포에서 표본을 뽑는 함수이다)
(단순히 이항분포를 만드는 함수가 아님!)
◈numpy.random.binomial◈
https://numpy.org/doc/stable/reference/random/generated/numpy.random.binomial.html
random.binomial(n, p, size=None)
'Draw samples from a binomial distribution. Samples are drawn from a binomial distribution with specified parameters, n trials and p probability of success where n an integer >= 0 and p is in the interval [0,1]. (n may be input as a float, but it is truncated to an integer in use)'
→ n과 p로 주어진 확률분포에서 size개의 sample 표본을 복원추출한다 (엄밀히 말하면 분포에서 size개의 확률변수 X를 추출함)
RETURNS>
'Drawn samples from the parameterized binomial distribution, where each sample is equal to the number of successes over the n trials.'
→ 이항분포에서 추출한 size개의 확률변수 X들로 이루어진 numpy array가 return됨
★ 추가적으로 n*p값이 5를 넘어야만 이항분포가 성립이 된다고 한다 ★
import numpy as np

np.random.binomial(n = 20, p = 0.5, size = 50)
#array([11,  8, 11,  8, 12,  6, 11, 13,  8, 10, 12,  6,  9, 11, 13, 11, 11, 8, 11, 12,  8, 11,  8, 10, 12, 10,  7, 12, 11, 13, 17,  8,  8, 11, 9, 10, 14, 11, 10, 14, 10,  8,  8, 11,  8,  9, 15,  5, 12, 10])
🥽 총 20개의 확률변수 return된 것 확인 가능!
이항분포 시각화
🥽 확률변수를 X(1부터 n), 주어진 X에 식(위 확률질량함수 식)을 넣어 반환된 확률질량함수를 y라 놓고 이항분포를 막대그래프로 시각화하자
🥽 확률질량함수 code
def binomial_density_func(k, n, p):
    nck = factorial(n) / (factorial(k) * factorial(n - k))
    probability = nck * p**k * (1-p)**(n-k)
    return probability
🥽 시각화 그래프 code
def viz_binomial(n,p):
    x = np.arange(n+1)
    y = np.array([binomial_density_func(k, n, p) for k in range(n+1)])
    plt.ylim(0, y.max())
    plt.title(f'n,p = {n}, {p}')
    plt.bar(x, y, color='lightcoral')
    plt.show()
🥽 (n,p) = (20, 0.3), (20, 0.5), (20,0.8) 차례대로 그래프 개형을 구해보면
for p in [0.3, 0.5, 0.8]:
    viz_binomial(20, p)
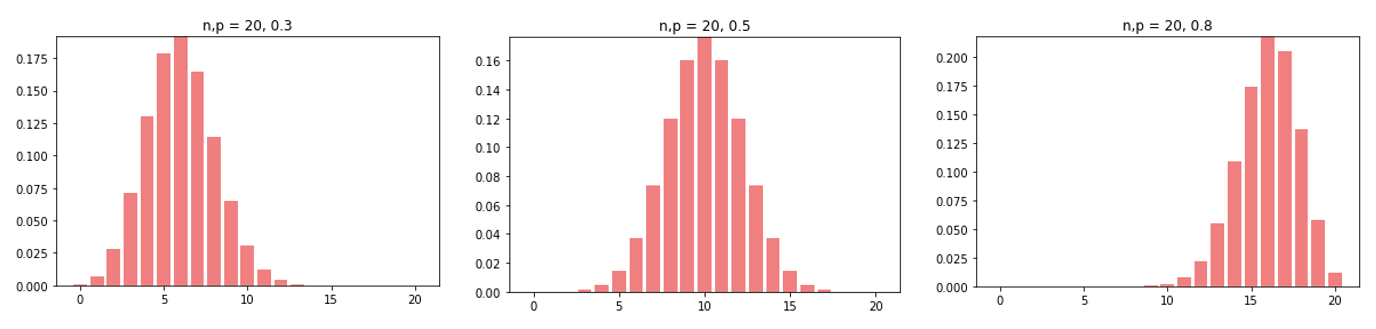
- (위) p에 따라 개형이 왼쪽 - 가운데 - 오른쪽으로 바뀌는 걸 확인 가능! -
* 출처1) ProDS (초급+중급)1
* 출처2) https://codetorial.net/articles/binomial_distribution.html
'Statistics > Concepts(+codes)' 카테고리의 다른 글
| Bayesian Theorem (0) | 2022.05.07 |
|---|---|
| distribution》poisson distribution (포아송분포) (0) | 2022.05.06 |
| Central Limit Theorem (CLT; 중심극한정리) (0) | 2022.05.05 |
| Law of Large Numbers (큰 수의 법칙; LLN) (1) | 2022.05.05 |
| f distribution (2) | 2022.05.04 |

댓글