*Intro
"To make any sort of data visualization, we need to define position scales, which determine where in a graphic different data values are located. We cannot visualize data without placing different data points at different locations, even if we just arrange them next to each other along a line. For regular 2d visualizations, two numbers are required to uniquely specify a point, and therefore we need two position scales. These two scales are usually but not necessarily the x and y axis of the plot. We also have to specify the relative geometric arrangement of these scales. Conventionally, the x axis runs horizontally and the y axis vertically, but we could choose other arrangements. For example, we could have the y axis run at an acute angle relative to the x axis, or we could have one axis run in a circle and the other run radially. The combination of a set of position scales and their relative geometric arrangement is called a coordinate system"
→ 뭐 당연한 소리... 2차원 data를 표현하기 위해서는 x와 y축이 당연히 필요하겠지..! 근데 꼭 x와 y끼리 90도를 이루는 건 아니구.
[1] Cartesian Coordinates
→ 이름은 그럴싸해보이지만 Cartesian Coordinates는 걍 좌표계..! x축과 y축
"Data values usually aren’t just numbers, however. They come with units. For example, if we’re measuring temperature, the values may be measured in degrees Celsius or Fahrenheit. Similarly, if we’re measuring distance, the values may be measured in kilometers or miles, and if we’re measuring duration, the values may be measured in minutes, hours, or days. In a Cartesian coordinate system, the spacing between grid lines along an axis corresponds to discrete steps in these data units. In a temperature scale, for example, we may have a grid line every 10 degrees Fahrenheit, and in a distance scale, we may have a grid line every 5 kilometers."
→ 우리가 나타내고자 하는 의도에 따라 동일한 정보여도 다르게 표현할 수 있다는 점..! (시각화의 power)
"Whenever the two axes are measured in different units, we can stretch or compress one relative to the other and maintain a valid visualization of the data. Which version is preferable may depend on the story we want to convey. A tall and narrow figure emphasizes change along the y axis and a short and wide figure does the opposite. Ideally, we want to choose an aspect ratio that ensures that any important differences in position are noticeable."
- 동일한 data임에도 무엇을 강조하고 싶은 지, 보여주고 싶은 메세지에 따라 제각각 나타낸다. (NOAA) -

→ 그렇다면 unit을 바꿔본다면?? Cartesian 좌표계는 바뀌지 않으므로 축만 바꾸면 그대로 표현 가능!
"You may wonder what happens if you change the units of your data. After all, units are arbitrary, and your preferences might be different from somebody else’s. A change in units is a linear transformation, where we add or subtract a number to or from all data values and/or multiply all data values with another number. Fortunately, Cartesian coordinate systems are invariant under such linear transformations. Therefore, you can change the units of your data and the resulting figure will not change as long as you change the axes accordingly"
[2] Nonlinear Axes
→ 위 Cartesian 좌표계는 linear. 하지만 data unit이 비균등하게 나뉘어져 나타내는 경우도 있다.
"In a Cartesian coordinate system, the grid lines along an axis are spaced evenly both in data units and in the resulting visualization. We refer to the position scales in these coordinate systems as linear. While linear scales generally provide an accurate representation of the data, there are scenarios where nonlinear scales are preferred. In a nonlinear scale, even spacing in data units corresponds to uneven spacing in the visualization, or conversely even spacing in the visualization corresponds to uneven spacing in data units."
1> logarithmetic scale
→ 대표적인 건 'logarithmetic scale'
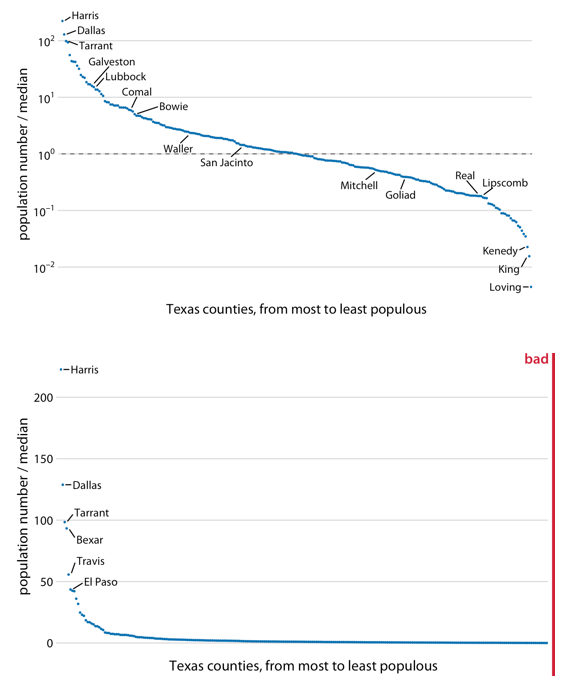
"Mathematically, there is no difference between plotting the log-transformed data on a linear scale or plotting the original data on a logarithmic scale. The only difference lies in the labeling for the individual axis ticks and for the axis as a whole. In most cases, the labeling for a logarithmic scale is preferable, because it places less mental burden on the reader to interpret the numbers shown as the axis tick labels." 'Log scales are frequently used when the data set contains numbers of very different magnitudes
(딱히 linear scale과 큰 차이는 없고 단지 visualization에서 xticks labelling을 어떻게 할 건가의 차이)
- ex)
- 위는 loarithmetic scale, 아래는 linear sclae - 확실히 차이가 난다. (위 선호!) -
2> square-root scale
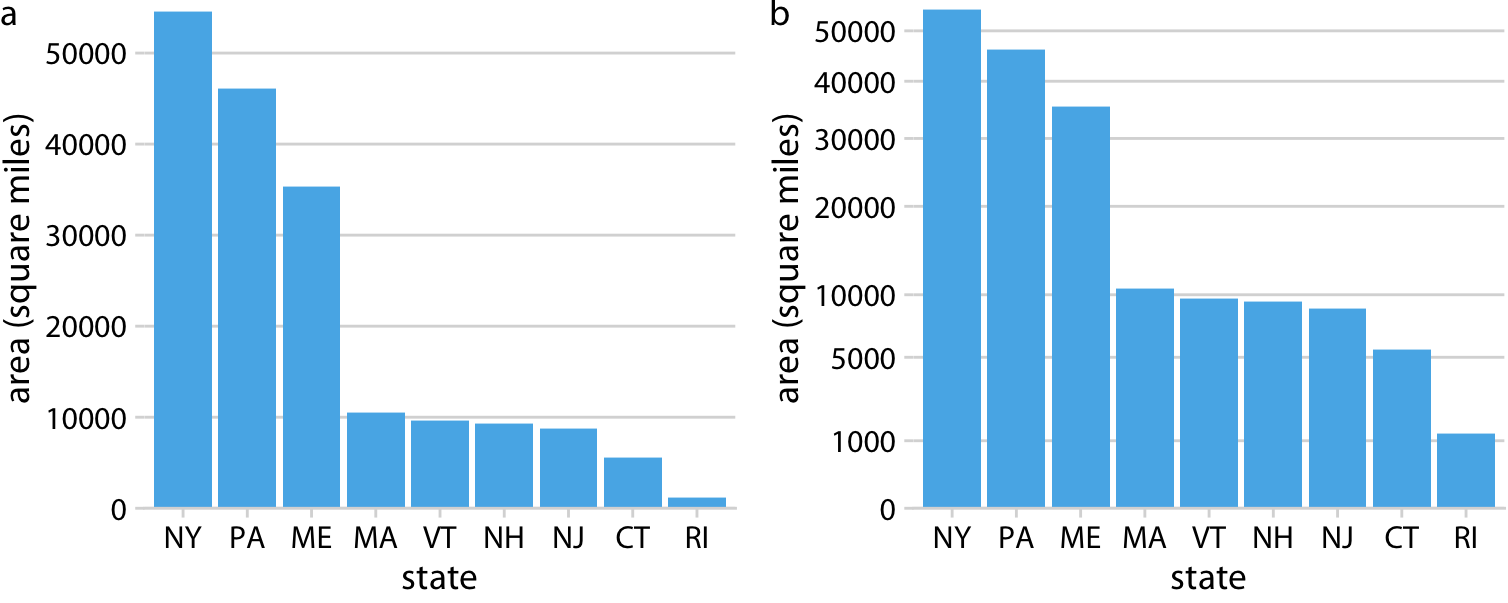
"Just like a log scale, a square-root scale compresses larger numbers into a smaller range, but unlike a log scale, it allows for the presence of 0"
→ log 좌표계의 경우 0이면 음수로 표현되기에 square-root scale로 표현하기
ex)
- square-root scale로 더 잘 표현 가능 -
[3] Coordinate Sytems with curved axes - Polar Coordinates
→ Cartesian 좌표계와 다르게 Polar Coordinates는 각도 & origin으로부터의 거리를 통해 나타낸다.
"All coordinate systems we have encountered so far used two straight axes positioned at a right angle to each other, even if the axes themselves established a non-linear mapping from data values to positions. There are other coordinate systems, however, where the axes themselves are curved. In particular, in the polar coordinate system, we specify positions via an angle and a radial distance from the origin, and therefore the angle axis is circular"
→ Polar coordinates는 주로 한 data 성격 상 끝부분이 다른 data와 이어질 때 쓰인다.
{1} periodic nature data
* 즉, 계절 & 시간 data에 많이 쓰임!
"Polar coordinates can be useful for data of a periodic nature, such that data values at one end of the scale can be logically joined to data values at the other end. For example, consider the days in a year. December 31st is the last day of the year, but it is also one day before the first day of the year. If we want to show how some quantity varies over the year, it can be appropriate to use polar coordinates with the angle coordinate specifying each day."
- (아래) 중심점으로부터의 거리는 온도 / 네 지역의 연간 월 평균 기온을 보여준다. -

{2} geospatial data
→ 지도 data에 많이 쓰인다. Cartesian 좌표계가 아닌 원의 형태로 나타내는 게 지구의 '구' 속성상 더 알맞다.
"A second setting in which we encounter curved axes is in the context of geospatial data, i.e., maps. Locations on the globe are specified by their longitude and latitude. But because the earth is a sphere, drawing latitude and longitude as Cartesian axes is misleading and not recommended"
✋ 출처) <Fundamentals of Data Visualization(Claus O.Wilke)> https://clauswilke.com/dataviz/introduction.html

댓글