💙 꼭 K가 들어가서 한국 부심으로 꼭 알아야(?)할 것 만 같은 데,, 필수로 알아야 하는 개념 마즘!
💙 앞서 우리가 Unsupervised Learning의 일종으로 대표적인 clustering 개념에 대해서 배웠고, 이 중 가장 대표적인 K-Means에 대해서 알아보자!
Unsupervised Learning
📌 사실 ML에서 지도학습(Supervised Learning)보다 정답이 주어져 있지 않은, 비지도학습(Unsupervised Learning) 기법이 더 까다롭고, 정답이 주어져 있지 않아서 분석에 힘이 들 때가 많다. 📌 비지도학습
sh-avid-learner.tistory.com
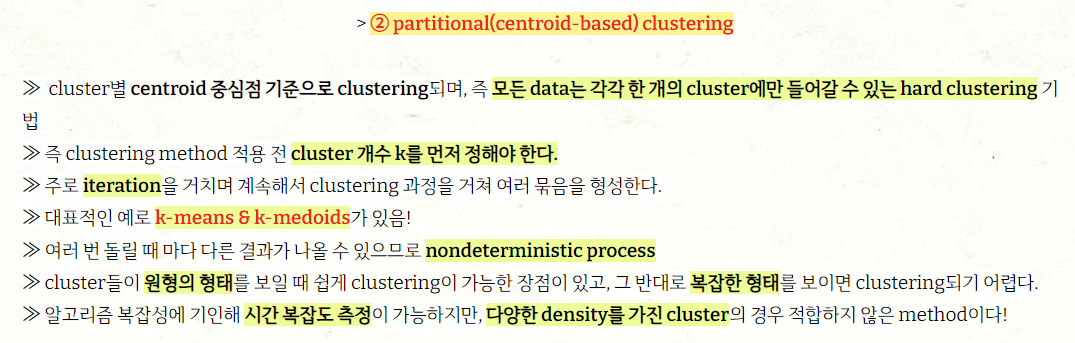
💙 일단 k-means는 unsupervised learning 기법 중 clustering - centroid-based clustering (hard clustering)기법이다.
step-by-step>
① cluster의 개수 k를 정한다 (k를 정하는 방법은 하단 내용 참조!) (아래 algorithm1 순서 1)
② 주어진 data에서 랜덤한 k개의 data를 cluster의 중심점으로 설정한다. (아래 algorithm1 순서 2)
③ 첫 번째 data에서 각 cluster 중심점까지의 거리를 cluster별로 각각 구한다. (아래 algorithm1 순서 4)
④ 각 cluster별로 구한 거리 중 최솟값에 해당되는 cluster로 해당 data를 할당한다. (아래 algorithm1 순서 5)
⑤ ③과 ④의 과정을 모든 data에 대해 반복한다. (아래 algorithm line 3 - repeat)
(※scikit-learn에서는 KMeans()의 인자 max_iter로 조절)
⑥ 변경된 cluster 각각의 중심점(mean)을 다시 구한다.
⑦ 변경된 cluster 기준으로 다시 모든 data에 대해 ③과 ④의 과정을 반복한다. (아래 algorithm 순서 6)
⑧ cluster가 변하지 않으면 완성!

→ 위 과정 ④에서 언급한 각 cluster별 구한 거리는 '각 data별 각 cluster별 centroid와의 Euclidean distance'이다. 이 distance가 가장 적게 나온 centroid가 포함된 cluster에 data가 포함된다.
👑 clustering의 평가?
→ 중심점이 변하지 않았고 최종적으로 k-means clustering이 마무리 되었다고 해서 끝난게 아니다. 해당 clustering의 적절성 평가를 위해 각각 모든 data와 해당 data가 속한 cluster의 centroid와의 squared Euclidean Distance를 data별로 모두 더한 값을 살펴본다.
(※ 해당 더한 최종값을 SSE(Sum of Squared Error)라고 간략히 부름)
→ 위 k-means 특징에 대해서 언급했듯이, k-means는 non-deterministic이라 처음에 centroid를 어떻게 잡느냐에 따라 다른 clustering 결과가 나올 수도 있다. 즉 초기 상태에 따라 SSE값이 제각각이며, 일반적으로 연구자들은 ①몇 번의 초기화를 통해 SSE가 가장 최소값으로 나온 경우를 최종 k-means clustering 결과로 택한다.
* KMeans() (from scikit-learn)>
「sklearn.cluster.KMeans() docu」
https://scikit-learn.org/stable/modules/generated/sklearn.cluster.KMeans.html
class sklearn.cluster.KMeans(n_clusters=8, *, init='k-means++', n_init=10, max_iter=300, tol=0.0001, verbose=0, random_state=None, copy_x=True, algorithm='lloyd')
- param 설명 -
🌝 n_clusters - cluster 개수
🌝 init - '‘k-means++’ : selects initial cluster centers for k-mean clustering in a smart way to speed up convergence. See section Notes in k_init for more details. / ‘random’: choose n_clusters observations (rows) at random from data for the initial centroids.'
→ 'k-means++'를 init 값으로 설정하면, 좀 더 빨리 centroid를 찾을 수 있게 적합한 clustering inital state에서 시작된다.
→ 'random'일 경우 적합한 initial state가 아닌, 온전히 random한 지점부터 clustering algorithm 연산이 시작된다.
🌝 n_init - 초기화 카운팅: 위에서 언급했듯이 실험할 때 n_init번 clusteirng을 진행하고, n_init번의 clusteirng 중 가장 SSE가 적게 나온 결과의 clustering 결과를 채택하게 된다
🌝 max_iter - clustering에서 최대 max_iter번 한 뒤의 결과를 cluster의 centroid로 정한다. (max_iter번 하기 전에 이미 centroid가 더 이상 변하지 않는다면 바로 clustering 결과로 채택)
- attributes -
🌝 cluster_centers_ - clustering하고 난 뒤의 각각의 cluster centroid 좌표를 return해준다.
🌝 inertia_ - 여러 번의 initialization으로 실험한, 여러 개의 최종 cluster 중 SSE가 가장 최솟값으로 나온 결과를 return
🌝 labels_ - 분류한 label 이름 return
🌝 n_iter_ - 위에서 max_iter 최대 횟수 내에서 최종적으로 n_iter번만큼 repeat한 뒤 centroid를 형성했는 지, n_iter 결괏값을 알려준다
(※ 당연히 init값을 'k-means++'로 설정했을 경우 n_iter값이 더 적은 결괏값으로 나온다)
★ kmeans.fit()에 data를 넣어주면 끝! ★
how to select the best K?>
* 일단 KMeans() 함수의 n_clusters 인자를 제외한 나머지 인자들을 원하는 대로 설정한다.
kmeans_kwargs = {
        "init": "random",
        "n_init": 10,
        "max_iter": 300
}
1> using elbow method (+KneeLocator)
》 SSE값의 변화를 살펴보는 method이다. cluster 개수가 증가할수록 SSE가 감소하는데, SSE가 최소가 되는 지점은 '모든 data가 각각의 cluster를 형성했을 때'이다. 따라서, 어느 적절한 시점에 cut 해 주어야 한다. cut 해주는 지점을 SSE가 큰 폭으로 감소하는 지점으로 정함!
》 SSE는 위에서 언급한 kmeans의 inertia_ 속성!
》 1) 직접 시각화해서 크게 감소한 point의 cluster 개수를 잡아내는 방법!
# A list holds the SSE values for each k
sse = []

for k in range(1, 11):
    kmeans = KMeans(n_clusters=k, **kmeans_kwargs)
    kmeans.fit(scaled_features)
    sse.append(kmeans.inertia_)

plt.style.use("fivethirtyeight") #후에 사용할 때는 default로 바꿔줘야 함!
plt.plot(range(1, 11), sse)
plt.xticks(range(1, 11))
plt.xlabel("Number of Clusters")
plt.ylabel("SSE")
plt.show()

→ number of clusters가 3인 point에서 큰 폭으로 감소된 지점이라 할 수 있으므로 k는 3으로 지정해야 적당하다.
》 2) KneeLocator를 사용 - elbow 속성 출력
kl = KneeLocator(
    range(1, 11), sse, curve="convex", direction="decreasing"
)

kl.elbow #3
→ 3 바로 출력
2> using silhouette coefficient
🥑 실루엣 계수는 총 두 가지를 평가한다. (1) 해당 data가 cluster 내에서 얼마나 다른 data와 가깝게 있는 지 / (2) 해당 data가 다른 cluster와 얼마나 멀리 떨어져 있는 지 - 즉! 해당 data가 다른 cluster로부터는 멀리, 자신이 속한 cluster에서는 다른 data와 가까운 지 - 얼마나 잘 모여있는 지를 확인하는 척도!
🥑 -1과 1 사이의 값을 가지며, 단적으로 값 하나로 출력이 되기 때문에 k값을 결정하기 매우 편리하다고 할 수 있다.
🥑 1에 가까운 큰 값일수록 best choice라 평가함!
🥑 silhouette_score method를 통해 알 수 있으며, 결과를 산출하기 위해선 당연히 최소 두 개의 cluster가 필요(다른 cluster와의 먼 정도를 측정하므로)하고 data(좌표)와 함께 집어넣으면 된다
from sklearn.metrics import silhouette_score
# A list holds the silhouette coefficients for each k
silhouette_coefficients = []

# Notice you start at 2 clusters for silhouette coefficient
for k in range(2, 11):
    kmeans = KMeans(n_clusters=k, **kmeans_kwargs)
    kmeans.fit(scaled_features)
    score = silhouette_score(scaled_features, kmeans.labels_)
    silhouette_coefficients.append(score)

plt.style.use("fivethirtyeight")
plt.plot(range(2, 11), silhouette_coefficients)
plt.xticks(range(2, 11))
plt.xlabel("Number of Clusters")
plt.ylabel("Silhouette Coefficient")
plt.show()

→ 갯수로 정한 3에서 실루엣 계수값이 가장 큰 값이 나오므로 역시 (해당 data의 경우) 3을 k로 정하면 된다.
w/code(using scikit-learn)>
① import 및 clustering을 위한 random data 준비 (make_blobs 사용)
(unsupervised learning의 일종이라 label 자체가 없는 data를 clustering하는 데,
해당 data의 경우 label이 이미 주어져 있다.
여기서는 우린 단순히 KMeans()로 실제로 잘 분류가 되었는 지 확인하는 과정일 뿐)
import matplotlib.pyplot as plt
from kneed import KneeLocator
from sklearn.datasets import make_blobs
from sklearn.cluster import KMeans
from sklearn.metrics import silhouette_score
from sklearn.preprocessing import StandardScaler

import numpy as np
import pandas as pd
import matplotlib
import seaborn as sns
import matplotlib.pyplot as pyplot
from matplotlib import pyplot as plt
▣ make_blobs docu() ▣
https://scikit-learn.org/stable/modules/generated/sklearn.datasets.make_blobs.html
'clustering을 위한 data를 random으로 생성해준다'
sklearn.datasets.make_blobs(n_samples=100, n_features=2, *, centers=None, cluster_std=1.0, center_box=(- 10.0, 10.0), shuffle=True, random_state=None, return_centers=False)
▶ 500개의 data가 3개의 cluster(cluster 표준편차는 3.75)를 형성하는 random한 data를 선택한다.
#data prepared
features, true_labels = make_blobs(
    n_samples=500,
    centers=3,
    cluster_std=3.75
)
② standardization (*StandardScaler() 사용)
▶ 축 별로 동일한 scale을 가지게끔 standardization 과정을 거침으로서, data의 어느 한 variable에 치우친 결과가 나오지 않게 한다.
scaler = StandardScaler()
scaled_features = scaler.fit_transform(features)
③ cluster 개수 k 정하기
▶ 위 elbow method & silhouette coefficients 두 가지 방법을 통해 k를 3으로 정했음 (위 참조)
④ KMeans() 돌리기 & data fitting
▶ 이 때 scaling된 data를 집어넣어야 함을 잊지 말기!
kmeans = KMeans(
        init = 'random',
        n_clusters = 3,
        n_init=10,
        max_iter=300
        #random_state=42
)

kmeans.fit(scaled_features)
⑤ 정리된 dataframe 만들기
▶2차원 data이므로 scaled된 모든 data의 x와 y좌표 - 각각의 data의 실제 label & KMeans로 분류한 label을 나란히 만들어본다.
#making a dataframe
df = pd.DataFrame(scaled_features)
df.columns = ['x', 'y']
df['true_label'] = true_labels.tolist()
df['KMeans_label'] = KMeans_labels.tolist()

df

▶ 여기서 true_label과 KMeans_label 숫자가 맞지 않음을 볼 수 있는데, 숫자는 kmeans initialization할 때 마다 그 때 그 때 달라지는 임의의 값이므로 상관할 필요 x
⑥ 시각화
▶ kmeans로 잘 분류되었는 지 육안으로 확인해 보기 위해 2차원 graph로 시각화
centroids = kmeans.cluster_centers_

plt.style.use("default")

def plot_clusters(df, column_header, centroids):
    colors = {0 : '#42f557', 1 : '#427ef5', 2 : '#f54842'}
    fig, ax = plt.subplots()
    plt.rcParams["figure.figsize"] = (6,6)
    ax.plot(centroids[0][0], centroids[0][1], "ok") # 기존 중심점
    ax.plot(centroids[1][0], centroids[1][1], "ok")
    ax.plot(centroids[2][0], centroids[2][1], "ok")

    grouped = df.groupby(column_header)

    for key, group in grouped:
        group.plot(ax = ax, kind = 'scatter', x = 'x', y = 'y', label = key, color = colors[key])
    plt.show()

plot_clusters(df, 'KMeans_label', centroids)
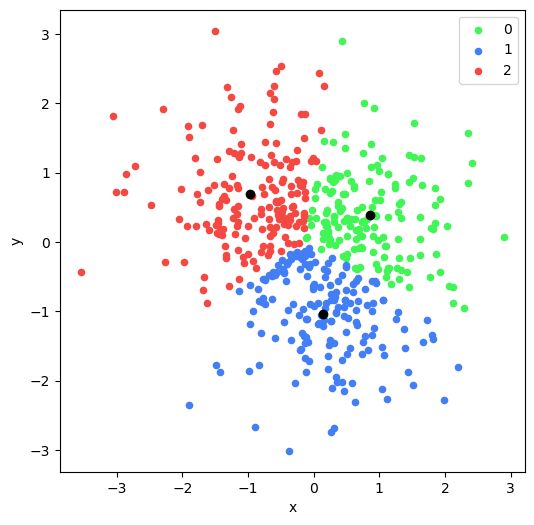
→ 시각화 결과 clustering된 data를 색깔별 확인 가능!
* 출처1) 갓 STATQUEST https://www.youtube.com/watch?v=4b5d3muPQmA
* 출처2) K-means & hierchical clustering https://www.youtube.com/watch?v=QXOkPvFM6NU
* 출처3) kmeans code 참조 https://realpython.com/k-means-clustering-python/
* 출처4) kmeans 시각화 & elbow method https://www.askpython.com/python/examples/plot-k-means-clusters-python
'Machine Learning > Models (with codes)' 카테고리의 다른 글
| (L1 Regularization) → LASSO Regression (concepts) (0) | 2022.06.23 |
|---|---|
| Decision Trees (concepts) (0) | 2022.04.27 |
| Logistic Regression Model (w/code) (0) | 2022.04.25 |
| Polynomial Regression Model (0) | 2022.04.24 |
| Logistic Regression Model (concepts) (0) | 2022.04.24 |

댓글