🌷 residual plot에서의 error관련 성질로 auto-corrleation을 무조건 짚고 넘어가는 경우가 많은데, 해당 corrleation이 무엇인지 알아보고
🌷 해당 auto-correlation이 존재하는 지 알아보기 위한 두 가지 방법 - Durbin-Watson test & Breusch-Godfrey test를 알아보자
* linear regression model 가정 → auto-correlation concepts

🍂 위 전제 2번에서 잔차 - residual에 대해 설명할 때, 잔차를 시각화한 residual plot에서 여러 error terms 오차항이 형성하는 일종의 pattern이 존재한다면 자기상관성 auto-correlation이 존재한다고 하였다.
🍂 저번 coursera 강좌에서 잠깐 다룬 내용을 확인하면,,
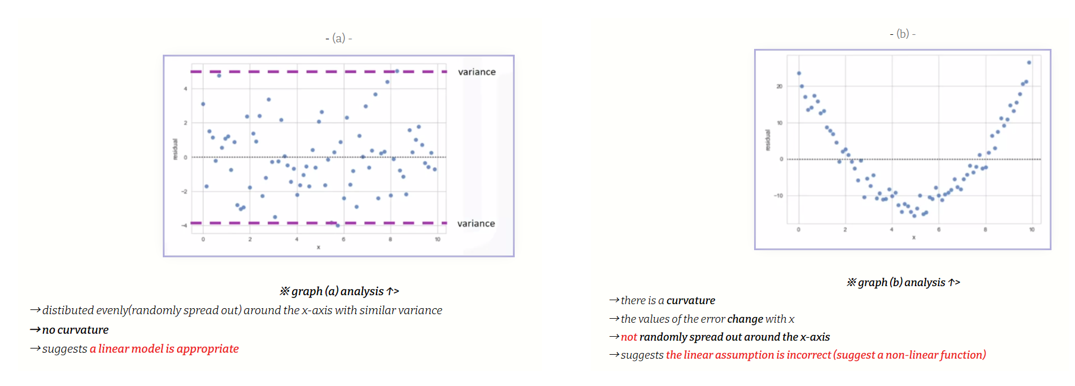
→ residual plot의 residual plot의 분포에 따라 해당 linear model의 적절성을 확인할 수 있다.
🍂 즉 위 두 그래프에서 제시한 residual plot에서 error term이 서로 상관관계를 가질 때 auto-correlation(또는 시계열 자료에서 많이 쓰여 serial correlation으로도 쓰인다.)이 존재한다고 하며, 일정한 시간간격으로 오차항이 서로 동일한 형태(양끼리, 또는 음끼리)를 보이면 'positive auto-correlation'이라 하고, 오차항들이 서로 반대 형태(음과 양)를 보인다면 'negative auto-correlation'이라고 한다. 이도 저도 아닌 상관성을 보이지 않는다고 하면 'uncorrelated'되었다고 하며 자기상관성이 존재하지 않는다고 판단한다
(즉, 한 error term $e_k$가 양(+)일 때, 옆의 $e_{k+1}$항도 양(+)을 보이는, 즉 잔차들이 일종의 pattern trend를 형성하면 자기상관성)
🍂 이렇게 자기상관성을 판단하는 방법은 크게 두 가지로, ①Durbin-Watson test와 ②Breusch-Godfrey test가 존재한다 (아래에서 다룰 예정!)
🍂 즉 선형모델에서 가정으로 둘 때, 자기상관성이 존재해서는 안된다는 가정이 꼭 들어간다. 당연히 오차항끼리 서로 연관을 보이는 pattern이 존재한다면, 변수들끼리 모두 독립적이라고 가정하고 regression modeling을 진행하는 데서 틀렸기 때문!
(따라서 detection tests로 반드시 자기상관성 유무를 파악하도록 하자)
🍂 주로 시계열 자료에 정말 많이 활용된다. 일정한 시간 간격을 둔 data끼리 연관성을 보이는, 일종의 pattern이나 trend를 보이는 경우가 매우 많기에, 주어진 시계열 data에서 앞으로를 예측하기 전에 자기상관성을 꼭 확인하고 가는 경우가 많다.
🍂 Q. 자기상관성이 존재한다면?
→ regression의 coefficients 계수만 영향을 받지 않을 뿐, standard error나 p-value는 사용할 수 없다. 따라서 우리는 p-value로 결론을 내리는, '어떤 특정 독립변수가 종속변수에 영향을 준다'라고 결론을 내릴 수 없다는 뜻!
→ 즉 우리는 자기상관성을 발견하면 해당 성질을 없앨 수 있는데, 빠진 변수나 함수 term이 빠진 경우가 있으므로 해당 변수나 term을 추가해서 해결하는 경우도 있다.
1> Durbin-Watson test
🌹 더빈-왓슨에서 알아야 할 성질 중의 하나는 '근처 residual term끼리만' test된다는 성질
(only looks at successive error terms)
🌹 Durbin-Watson d-statistic
$d_w = \cfrac{(e_2 - e_1)^2 + (e_3 - e_2)^2 + ... + (e_n - e_{n-1})^2}{e_1^2 + e_2^2 + ... + e_n^2}$
🌹 $d_w$값은 0에서 4까지의 범위를 가지고 2 부근의 값이 나오면 uncorrelated 되었다 판단, 4에 가까우면 negatively correlated, 0에 가까우면 positively correlated 되었다 판단한다.
🌹 range 0 from 4 ($d_w$)
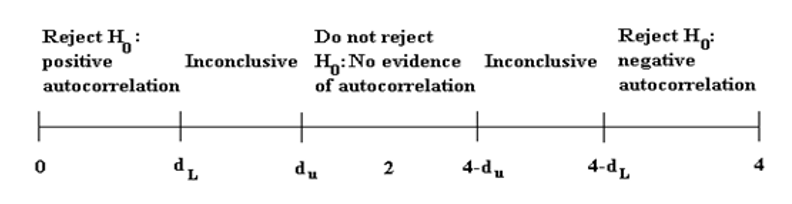
🌹 주어진 관측치의 수 n & intercept를 제외한 regressor 수(즉 x 변수 개수) k 두 개와 significance level을 참조하여 위의 $d_u$와 $d_L$값을 정한다.
(아래 durbin-watson table은 직접 구글링하면 찾을 수 있다. 아래 출처 참고)
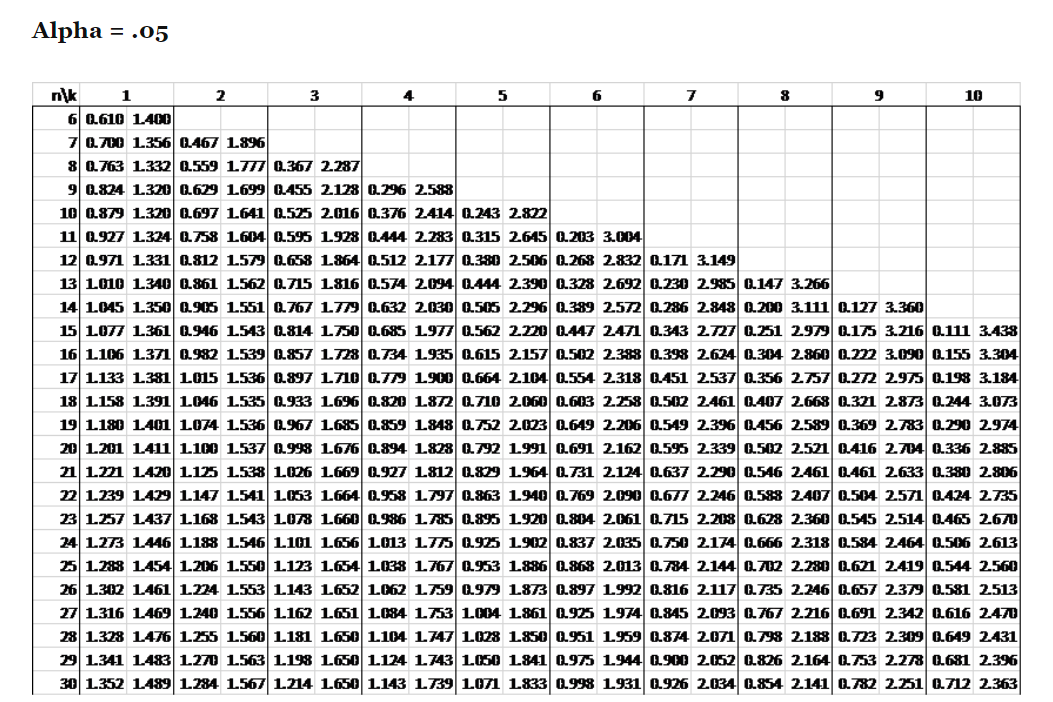
🌹 위 table과 같이 alpha값 0.05일 때를 많이 사용하고, k는 주로 10이하인 case가 가장 빈번하게 사용된다. ($d_L, d_u$ 순서)
* 실습>
① time-series data kaggle dataset 세 개 준비 & import
- 오스트리아 월별 맥주 소비량
- 샴푸 소비량
- 전기 생산량
import numpy as np
import pandas as pd
import matplotlib
import seaborn as sns
import matplotlib.pyplot as pyplot
from matplotlib import pyplot as plt

from statsmodels.formula.api import ols #ols model - residual calculation
from statsmodels.stats.stattools import durbin_watson #durbin_watson method
import statsmodels.tsa.api as smt #visualizing residuals
df = pd.read_csv("monthly-beer-production-in-austr.csv")

df.isnull().sum()

df['Month'] = pd.to_datetime(df['Month'])
② 시각화 및 dataframe 생성
plt.figure(figsize=(10,5))
plt.title("Monthly beer production in Austria", fontsize=15)
plt.plot(df["Month"], df["Monthly beer production"], "-", color='#A69037')
plt.grid()
plt.xticks(rotation=90)
plt.show()

lst = list(range(1,476+1))

production = df["Monthly beer production"].to_list()

new = pd.DataFrame({'time':lst, 'production':production})
③ 주어진 dataframe의 independent, dependent variable 선택 + d-통계량 출력 + autocorrelation(residual plot) 그래프 시각화 함수 생성
def durbin_watson_func(y, X, df, n):
    # y - dependent variable
    # X - independent variables
    # df - dataframe of y and X
    # n - (a number of data points - 1)

    #fit multiple linear regression model
    model = ols(formula = f'{y} ~ {X}', data=df).fit()

    print('durbin_watson d statistic: ', durbin_watson(model.resid))

    acf = smt.graphics.plot_acf(model.resid, lags=n , alpha=0.05)
④ 총 세 개의 dataset의 time-series 시각화와 durbin-watson 결과를 비교하면 아래와 같다.

⑤ 결과분석
✔️ 맥주와 전기 생산량 그래프는 the number of data points가 300개가 넘는다. 따라서 시계열 데이터 특성상, 그리고 시각화 그래프를 보았을 때 대체적인 트렌드를 읽을 수 있으므로, 특정 데이터 기준 앞뒤로 서로 영향을 받는다고 할 수 있다. 즉 자기상관성이 높다고 예측이 가능한데, 실제로 하단 autocorrelation 그래프를 보면 특정 무늬를 띄는 pattern 확인이 가능함. durbin-watson d-통계량도 dL값보다 적은 값으로 측정되어 'positive auto-correlation'을 갖는다고 말할 수 있다.
✔️ 반면에 중간 그래프 샴푸 판매량의 경우 the number of data points는 35개밖에 안된다. 시계열 그래프이기는 하지만 data 수 자체가 적어 자기상관이 작용한다고 보기 어려울 거라고 추정할 수 있다. 실제로 하단 autocorrelation 그래프에서 눈에 띄는 패턴을 찾기 힘들고, 실제로 durbin-watson d-통계량도 2에 매우 가까운 값으로 자기상관이 존재하지 않는다고 말할 수 있다.
++
breusch-godfrey test 추후 참조
* 출처1) autocorrelation + two detections + remedies 설명 https://www.youtube.com/watch?v=UFvDSX3jsYg
* 출처2) 자기상관성 설명 https://m.blog.naver.com/PostView.naver?isHttpsRedirect=true&blogId=yonxman&logNo=220960992282
* 출처3) auttocorrleation wiki https://en.wikipedia.org/wiki/Autocorrelation
* 출처4) autocorrelation 개념 https://corporatefinanceinstitute.com/resources/knowledge/other/autocorrelation/
* 출처5) durbin-watson table https://www.real-statistics.com/statistics-tables/durbin-watson-table/
* 출처6) 자기상관계수 설명 https://otexts.com/fppkr/graphics-autocorrelation.html
* 출처7) autocorrelation 시각화 참조 https://www.youtube.com/watch?v=FiBBpscb6es
* 출처8) 식 markdown 일부 참조 https://github.com/bhattbhavesh91/durbin-watson-test-python/blob/master/durbin-watson-notebook.ipynb
* code 일부 참조) https://yganalyst.github.io/etc/visual_2/
* time series dataset(beer production in Austria) 출처) https://www.kaggle.com/datasets/podsyp/time-series-starter-dataset
'Statistics > Concepts(+codes)' 카테고리의 다른 글
| MLE for the normal distribution (1) | 2022.06.27 |
|---|---|
| Maximum Likelihood Estimation(MLE) (1) | 2022.06.26 |
| Bayesian Theorem (0) | 2022.05.07 |
| distribution》poisson distribution (포아송분포) (0) | 2022.05.06 |
| distribution》binomial distribution (이항분포) (0) | 2022.05.06 |

댓글